Pre-Lab
1. What are the variables in this experiment?
Independent: catch size, number of catches taken.
Dependent: accuracy of the estimated population size
Control: size of the fish
2. Write the problem in the form of a question.
How accurate will using tagged fish be in determining population size?
3. Create a hypothesis as to which variables will yield the most accurate estimate of the population's size.
If fish are tagged and then taken in different catch sizes and number of catches, then the population with the most number of catches will be the most accurate in determining population size.
Parts of the Experiment
Independent: catch size, number of catches taken.
Dependent: accuracy of the estimated population size
Control: size of the fish
Experimental Groups: All
Control Groups: N/A
Dependent: accuracy of the estimated population size
Control: size of the fish
Experimental Groups: All
Control Groups: N/A
Hypothesis
If fish are tagged and then taken in different catch sizes and number of catches, then the population with the most number of catches will be the most accurate in determining population size.
Problem
How accurate will using tagged fish be in determining population size?
Materials List
-Brown paper bags
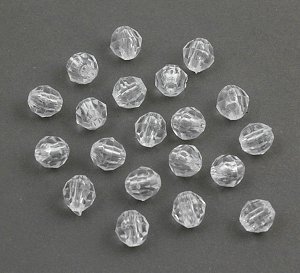
-Clear beads
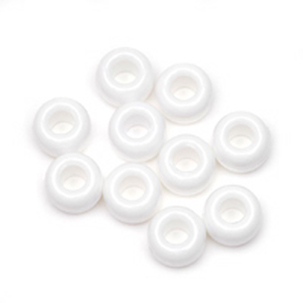
-White beads
-Pencil
-Paper
-Clear beads
-White beads
-Pencil
-Paper
Procedure
1. Receive specific instructions that detail how many catches are to be done
2. Record the number of beads in the bag (this is your total population)
3. Replace some of the clear beads with white beads. The white beads indicate that they have been tagged.
4. Mixed the tagged and the untagged beads together
5. Take out a relatively normal sized handful of beads and record the total number of beads, and the number of tagged beads.
6. Put the beads back in the bag and repeat steps 4 and 5 the indicated number of times.
7. Calculate the percent tagged in each catch group.
8. Calculate the estimated population
9. Calculate the percent error by using the estimated population and the actual population
Observations
-Some catch sizes were bigger than others because there was no precise number for a handful of beads
-The percentage of error varies drastically. The lowest is 9 percent and the highest is 57.
-As the experiment proceeded, groups were losing beads on accident.
-The number of tagged fish seem to have no drastic effect on the percentage of error.
-The percentage of error varies drastically. The lowest is 9 percent and the highest is 57.
-As the experiment proceeded, groups were losing beads on accident.
-The number of tagged fish seem to have no drastic effect on the percentage of error.
Data Table and Graphs
Analysis and Conclusions
1. What could cause the population size estimate to be different from the actual population size?
Poor representation with a catch could cause the estimate to differ from the actual population size.
2. How can the size of your catch sample compared to the actual size of the population affect population estimate?
The greater the catch size, the more accurate the results will be.
3. How can the number of samples (or catches) affect the results?
The more samples of catches, the more accurate the results should be because it will show a greater representation for the fish population.
4. Does this method appear to be an effective way to assess population size? Why or why not?
No this method does not appear to be an effective way to assess population size because it has percentage error up to 57 percent.
5. If you were predicting a large population (like an actual ocean fishery) would your percent error be very large?
It would seem that the larger the population that is being predicted, the larger the percent error because there is a greater population to represent with a smaller catch.
6. What concerns should a biologist have about a species’ habits before (s)he uses this method to approximate the size of a population?
The biologist would be concerned with mating season, where the greatest population is located, and how long it will take for the tagged fish to be caught again (how soon will the tagged specimen attempt to eat again after being caught)
General Conclusion:
The hypothesis was not supported by the experiment. The hypothesis was wrong because it assumed that a greater number of catches meant a greater, more accurate representation of the general population. However, it was the least number tagged and the least number of catches that gave the most accurate results. The number of trials nor tagged size seemed to have a profound effect on the percentage error, since the percentages are scattered throughout. A possible explanation for this is the experimenters ability to randomly catch an accurate representation of tagged fish vs. the total population. This experiment could be improved by implementing a more accurate way to catch the fish. With the current method, the chances of catching tagged fish are left to random probability. If an accurate catching system were to be introduced, the experiment would yield a more accurate representation of the general population in each catch. To answer the problem, the experiment's results were not that accurate. With multiple groups testing the experiment, it is fair to conclude that these means of calculating population size are inaccurate at best. The problem with the catch and release method is it has too many loose ends. In real life, weather and food will effect a population size in a current area. The Lincoln index protocols call for a 24 hour period before catching again, but in 24 hours, large amounts of a population can move because of cold fronts, etc. As shown with the inaccuracy of the experiment, catch and release experiments are faulty.
"Estimating Population Size." N.p., n.d. Web. <http://www.compulink.co.uk/~argus/Dreambio/ecology/estimating%20population%20size.htm>.
