Pre-Lab
1. Why would we want to rate the amount of biodiversity in a location?
The amount of biodiversity is an indicator of other factors such as how healthy the environment is. The greater the amount of biodiversity is an indicator the environment is healthy and is able to support a larger amount of life.
2. Examine the charts below and calculate the diversity indices for the three samples:
Sample 1: Simpson’s Index: .18; Simpson’s Index of Biodiversity: .88; Simpson’s Reciprocal Index: 5.55
Sample 2: Simpson’s Index: .25; Simpson’s Index of Biodiversity: .75; Simpson’s Reciprocal Index: 4
Sample 3: Simpson’s Index: .92; Simpson’s Index of Biodiversity: .08; Simpson’s Reciprocal Index: 1.09
3. Use the results from the previous question to describe the biodiversity of each sample.
Sample 1 had the greatest biodiversity of each sample. All three samples had the same richness; however, sample 1 had the greatest evenness with each species having 10. Sample 2 had the second greatest biodiversity. Sample 2 had the same richness; however, species 1 and 2 had the clear majority compared to the other species found in sample 2. Sample 3 had the lowest biodiversity. Species 1 was the clear majority with the other species lacking in population, making the environment not very diverse.
Parts of the Experiment
Control Variables: There were no control variables in this experiment
Independent Variable: The locations that the leaf litter samples were taken.
Dependent Variable: The species diversity within the samples
Control Group: There was no control group in this experiment
Experimental Group: The leaf litter samples that were collected.
Independent Variable: The locations that the leaf litter samples were taken.
Dependent Variable: The species diversity within the samples
Control Group: There was no control group in this experiment
Experimental Group: The leaf litter samples that were collected.
Problem
What is the biodiversity of the organisms found in the trail's ecosystem?
Hypothesis
If leaf litter samples were collected from different parts of the trail and tested to determine the biodiversity of the species found within the samples, then the biodiversity would not be very great.
Materials List
-Leaf litter samples
-soil samples
-alcohol
-beakers
-heat lamp
-ziploc bags
-scissors
-gallon container with open top
-cheese cloth
-petri dish
-microscope
-soil samples
-alcohol
-beakers
-heat lamp
-ziploc bags
-scissors
-gallon container with open top
-cheese cloth
-petri dish
-microscope
Procedure
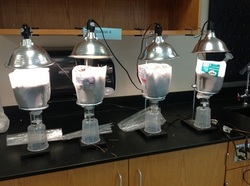
1.Collect leaf litter samples and place them in ziploc bags.2.Cut open a hole at the bottom of the gallon container and secure cheese clothe over the hole.
3.Place the gallon container with the cheese cloth end downward over a beaker filled with alcohol
4.Empty the sample into the gallon container.
5.Turn on the heat lamp and leave it on for 24-48 hours
6.Empty the contents from the beaker into a petri dish and examine under a microscope
7.Collect data of the species
Observations
Location: Wake Forest, North Carolina
Type of Community: Urban
Date: Thrusday, September 20, 2012
Weather Descrpition: Warm, Humid, Sunny, clear skies
Air Temperture: 76°
Soil Temperture: N/A
Relative Humidity: 72
Time: 11:15 - 12:00 P.M.
The locations of the samples seemed to have an impact on the number of species and variety of species collected. The sample locations are as follows: Sample 1- Sunny and dry, Sample 2- Sunny, Sample 3- Shaded soil, Sample 4- Sunny soil, Sample 5- Riverside soil, Sample 6- Shaded. The soil samples yielded no results in the experiment.
Diversity Calculations:
Simpson’s Index: .233
Simpson’s Index of Diversity: .767
Simpson’s Reciprocal Index: 4.29
Data Tables and Graphs
Analysis and Conclusions
Questions:
1. What are two reasons the organisms move away from the light down the funnel? What does this indicate about the organisms?
The organisms move away from the light and down the funnel because the light imitates both the heat and light from the sun. Since the organisms move away from this mock sun, it can be inferred that the organisms prefer cooler and darker climates.
2. Summarize whether you think the biodiversity of this litter is high or low density. If low, try to give some reasons why this might be.
The biodiversity of the experiment's litter is of high density since a good variety of species were present. They species were fairly distributed among the samples, with the exception being the Predacious Mites. Sample 6 seems to be the outlier because the sample contained nearly all of the population of predaceous mites. The variety of species indicates general biodiversity.
3. Why would an environmental scientist need to make more than one measurement if he was calculating the biodiversity? How would you take samples of a large forest?
The scientist would have to take multiple samples to ensure accuracy of his experiments, because there are outliers like sample 6. I would divide the forest into sectors and take samples of each individual sector and analyze the data in that manner.
General Conclusion:
The results did not support the hypothesis very well. The results indicate a relatively moderate to high biodiversity among the trail. Although the data was only taken once, it indicates that the trail's ecosystem is fairly healthy. The trail seems to be optimum for the species that were collected in the litter. The experiment showcased biodiversity, but this is not the only measurements of health for the trail ecosystem. The water quality and plant diversity should have been tested as well to determine whether the trail is healthy. The experiment had several faults. The greatest fault being the quantity of measurements. The measurements should have been taken multiple times over a certain period to determine the true diversity of the species of the trail. Also, soil samples were collected to tightly. The soil was compacted inside the container which caused the heat and light of the lamp to not reach the species contained deeper within the dirt sample. This problem has contributed to the lack of species in the petri dish. Since there was no motivation to move, the organisms did not exit through the funnel.
Biodiversity loss is a serious issue in some parts of the world. It indicates unhealthy ecosystems. Such is the case of Australia. Australia's biodiversity has greatly declined over the past years due to human development. This experiment models a standard biodiversity test. The experiment can be applied anywhere, like Australia. The loss of biodiversity can be a warning sign that indicates the need to change or fix something. Biodiversity should be monitored tas a precaution of ecosystem destruction.
"Australia's Biodiversity." Australia's Biodiversity. N.p., n.d. Web. 24 Oct. 2012. <http://www.environment.gov.au/biodiversity/>.
