Air Quality Lab
Pre Lab
1. 1.Create a chart showing the six air pollutants, causes, and concerns from the information in the pre-lab
2. Why is ground level ozone highest in the summer and almost nonexistent in the winter? How might this affect our results as we test the air during this part of the year?
The ground level ozone is the highestin the summer because the heat and sunlight activates NOx and VOC's to create ozone. It is the lowest in the winter because heat and sunlight are not as abundant.
The ground level ozone is the highestin the summer because the heat and sunlight activates NOx and VOC's to create ozone. It is the lowest in the winter because heat and sunlight are not as abundant.
3. Many third world countries still use leaded gasoline (since they have older cars or since they have not forced changes). What concerns may the governments of these countries need to deal with?
The governments need to deal with the concerns of lead poisoning. These include organ damage, nervous system failure, brain damage, and sometimes death.
The governments need to deal with the concerns of lead poisoning. These include organ damage, nervous system failure, brain damage, and sometimes death.
4. Use the internet to find what parts of North Carolina are not in compliance with the Standards of the Clean Air Act.
The counties in the western piedmont region are not in compliance with the Clean Air Act; Mecklenburg county is a specific example.
The counties in the western piedmont region are not in compliance with the Clean Air Act; Mecklenburg county is a specific example.
Parts of the Experiment
Independent Variable: the location of the ozone strip and particulate matter slides (inside the building and on the trail)
Dependent Variable: the particles collected, the ozone measurements
Controlled Variables: The time allotted for the Vaseline to collect particles, the location of particle and ozone testing
Control Group: the experiment in the petri dish (no exposure to outside environment)
Experiment Groups: the particulate matter slides in the building and on the trail, the ozone slip on the trail
Hypothesis
If the quality of air were to be tested inside of the school and outside on the trail, then the air quality inside the school will be best, but the outside air quality will be fairly good as well.
Problem
What is the air quality of Wake Forest as described by Ozone and PM measurements?
How does the air quality of the school compare to the air quality of Wake Forest?
How does the air quality of the school compare to the air quality of Wake Forest?
Materials List
- Q-tips
- Vaseline
- Index Cards
- Filter Paper
- Microscopes
- Microscope slides
- String
- Vaseline
- Index Cards
- Filter Paper
- Microscopes
- Microscope slides
- String
Procedure
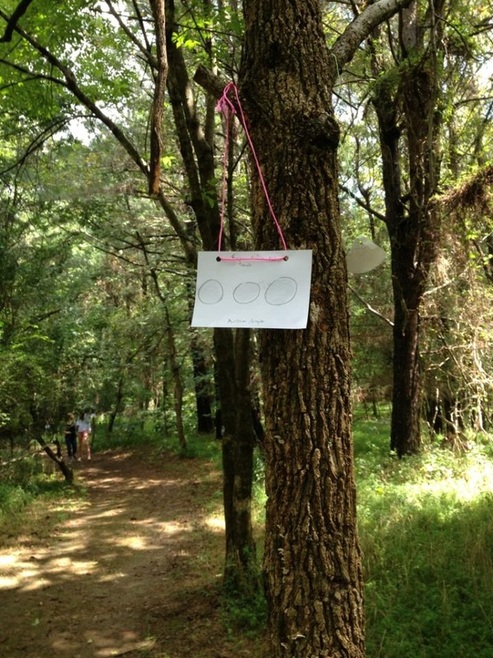
1. Draw three circles on two index cards and label them "experiment-do not touch"
2. smear Vaseline in each of these circles with a Q-tip.
3. punch two holes in each of these index cards and use string to hang one inside and one outside in an area that is found suitable for testing
4. Smear ozone testing fluid on filter paper and hang it outside in either the same, or a different suitable testing area
5. Wait at least 24 hours before removing the indicators
6. Remove the indicators
7. Look at the indicators under a microscope and record the results
Observations
Weather: Sunny on Friday(9/7/12), Sunday, and Monday, Rain on Saturday
Temperature on 9/10/12: 22°C
Relative Humidity on 9/10/12: 65%
Inside particulate matter slide (location: ceiling of 2600 hall): none
Outside particulate matter slide (location: zone 2 of trail): light.
Outside ozone monitoring strip (location: zone 2 of trail): 150 ppb.
Control ozone monitoring strip (location: petri dish): 0 ppb
Control particulate matter slide (location: petri dish): none
Data Table and Graph
Not applicable to this specific lab.
Analysis and Conclusions
During this experiment, there were several factors that could have skewed the results. The biggest factor that could have affected the results was the rain over the testing period. The rain could have washed off the particulate matter or affected the ozone reading. Another factor might have been the testing locations. If the inside particulate matter indicator were placed in a highly trafficked section of the school, then it probably would have shown some difference. This just shows how uncontrollable things can impact the results of an experiment. Overall, I would say the air quality in Wake Forest was very healthy, but the air quality inside the school was even more healthy. The results did, in fact, prove the hypothesis correct. An improvement that could be made on this experiment is picking a date with normal weather patterns.
